York Against Cancer Enthuse partnership bioinformatics session: using cBioPortal to explore TP53 mutations
This teaching material was designed as the second part of Dr Simon Baker's York Against Cancer Enthuse partnership project TP53 practical, providing hands-on bioinformatic analysis of real cancer sequencing data. This material can be used directly as a broswer-based tutorial, or adapted with acknowledgement into a specific lesson plan.
The material presented below is divided into a core analysis of TP53 mutations across the 32 different cancer studies of The Cancer Genome Atlas, and then a set of three case studies which expand the biological interpretation and applications of cBioPortal in cancer bioinfomatics. We anticipate that the teacher-led session will focus on the core analysis, with students and teachers able to access the entire set of material indefinitely.
The video embedded below is a walkthrough of the core exercises by Dr Andrew Mason.
Introduction
In your laboratory session you identified a mutation in TP53 (R273H) using a restriction enzyme site created as a result of the mutation. Excellent work! By finding this specific mutation in the P53 protein ("the guardian of the genome"), you will be able to recommend Eprenetapopt, a drug which targets mutant versions of P53, reducing the tumour's ability to grow. Not bad for a simple lab-based assay!
Using mutations to subtype different types of cancer improves our ability to treat cancer properly in the clinic. This is a move towards personalised medicine. But, how did researchers know this mutation existed, and how often do we find it in people with cancer? Commonly occuring mutations, known as hotspots, help us prioritise efforts for drug development, where one drug can help the most people.
In this session you will explore TP53 mutations in over 10,000 cancer samples using cBioPortal, a publicly available online resource for cancer genomics. Data mining is now a huge part of biomedical research, and the discipline of bioinformatics combines computational analysis with the interpretation of biological data. You will use the results of tumour DNA sequencing data from 32 different cancer types within The Cancer Genome Atlas (TCGA) study, an enormous international study to better understand the diversity of genetic changes in cancer.
Learning objectives
These six learning objectives cover both the laboratory and bioinformatic parts of the partnership project. Here we will focus on objectives 4, 5 and 6.
- Understand how to move small volumes of liquid with a pipette
- Understand the specificity of restriction digest enzymes
- Experience loading and running an electrophoresis gel
- Feel more confident when talking about cancer biology
- Think about how DNA mutations contribute to cancers
- Consider how a specific type of DNA mutation present in a cancer might define the choice of treatment they receive
The Session
If you follow the guided steps below, you will explore cBioPortal and investigate the prevalence of different types of TP53 mutations across different cancers. If you enjoy it, there are then three case studies which introduce you to the complexity of cancer biology by seeing how different cancers exploit different parts of normal cell biology. Look out for 'explainer' links - these give more information and background to the concepts and data used in the session.
I would recommend using a computer or a tablet for this session, rather than a phone. cBioPortal hasn't really been designed with phones in mind, and you'll find everything a bit small and tricky to navigate.
Take your time and explore the website and data - you could spend days on this website and still find brand new results. If you get lost, go back to the cBioPortal homepage and you're only a few clicks from where you need to be!
1 Open the cBioPortal website
Open up any web browser and head to www.cbioportal.org
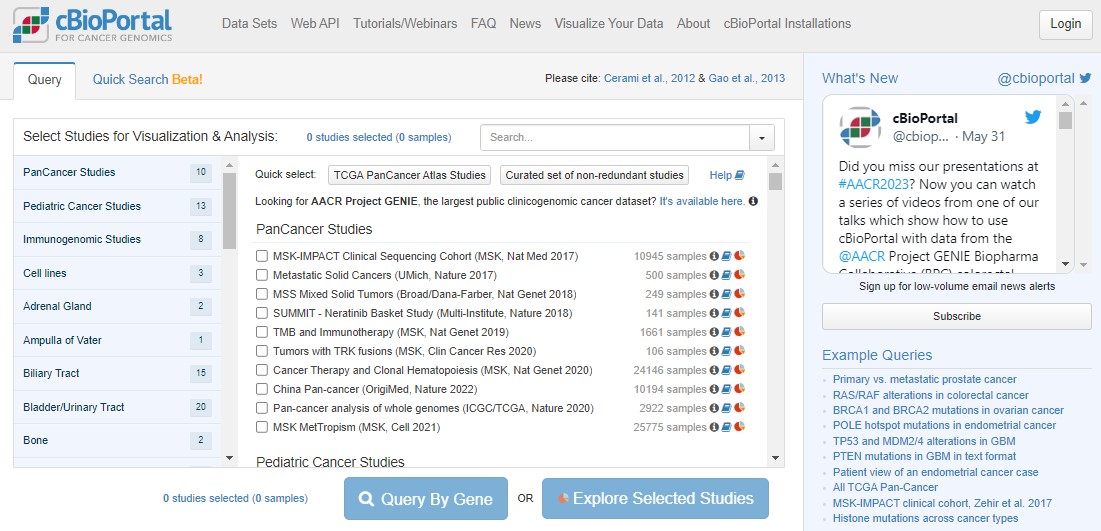
The home screen (pictured below) gives immediate access to results from sequencing data generated from thousands of cancer samples from all over the world. Scroll down the list. Each study represents potentially years of work from doctors, surgeons and nurses in hospitals to recruit patients, work with families and collect samples, and then from biomedical researchers in universities to process the samples, then generate, analyse, interpret and publish the results.
EXPLAINER What is cBioPortal and where does the data come from?
EXPLAINER What is sequencing?
2 Select the pancancer TCGA dataset
Return to the top of the cBioPortal homepage. We're going to work with The Cancer Genome Atlas (TCGA) pancancer study. "Pan" in this context just means "across lots of different cancers".
Click the Quick select link for TCGA PanCancer Atlas Studies. You have just loaded data for 32 different cancer studies and 10967 samples coming from 10528 different people! Next, click on the blue Query By Gene button, scroll to the bottom and type TP53 into the Enter Genes box, then Submit Query.
EXPLAINER What is The Cancer Genome Atlas?
EXPLAINER Why are gene and protein names different?
3 Explore the TP53 OncoPrint plot
Lots of colours! Don't panic. An OncoPrint is a big summary of mutation data - is there a mutation in a particular sample, and what type of mutation is it? In an OncoPrint each column represents a single sample. You have loads of samples, so everything is very squished.
You can largely ignore the three "Profiled for..." rows - these just indicate which sequencing technologies were used on those samples. For example, you'll see a large number of glioblastoma samples were only profiled for copy number changes, not mutations or structural changes.
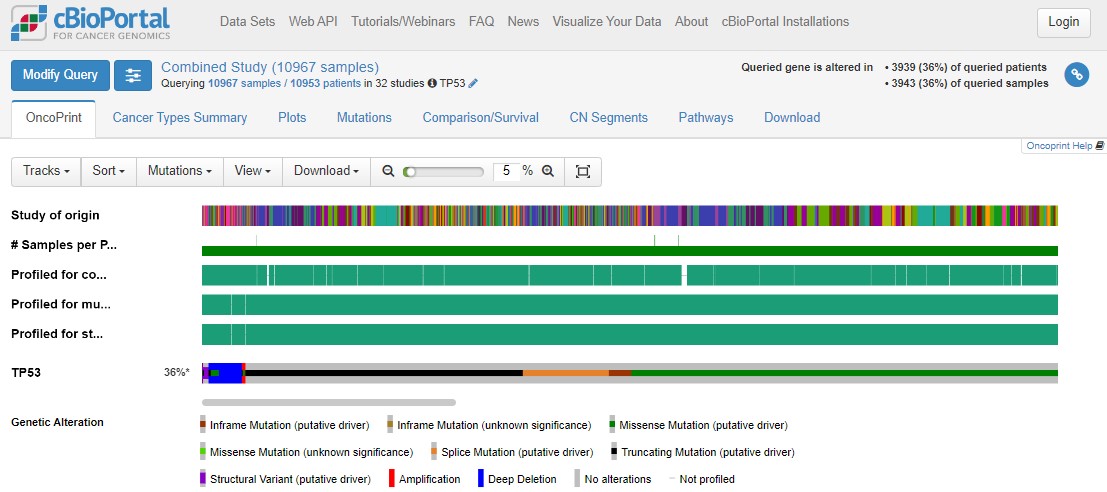
Use the zoom slider to go to 1%, then you can see the whole cohort, and see that TP53 is mutated in 36% of the queried samples. Some patients have multiple samples, hence the disparity in patient/sample numbers (top right).
Use the zoom slider or the mouse (click and hold to draw a small box over the OncoPrint) to zoom right in on a small number of samples. Hovering over individual samples gives more information such as the number of samples per patient (usually 1), the tumour study (top row) and the specific mutation(s) in a patient (bottom row). Some mutations have symbols attached to show any information we might have on what that mutation does. A blue target suggests it is oncogenic (i.e. important in cancer). Flames show it is a hotspot mutation (i.e. mutated in lots of people). Sometimes mutations can be tolerated by cells, or we simply don't know yet if that specific mutation impacts how the protein works.
A potentially new concept for you will be copy number changes. This literally means how many copies of each gene a person has in every cell in their tumour. In healthy cells we should have 2 copies of every gene (as we are diploid organisms), with some exceptions when genes are found on the X/Y chromosomes. In cancers the genome can be very unstable and this can lead to deletions of some parts of the DNA, or amplifications where you get more than 2 copies of genes. This can have a huge impact on tumour biology!
With TP53, nonsense mutations are important (where cancers break the P53 proliferation brakes), but the same effect happens from a deep deletion of TP53 (where the brakes get totally removed). This is a really important concept in cancer biology: different types of mutations can have the same impact on tumour biology. This can mean that the same drug can be given to people with different mutations, such as P53 mutations R175H, R248Q, R273C, R273H, R273L and R282W, as these mutations all change how P53 binds to DNA.
EXPLAINER Which mutations are likely to have an impact in cancer?
4 TP53 hotspots
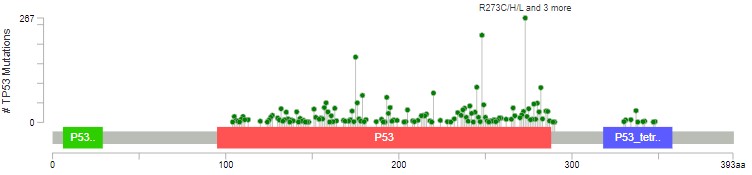
Click on the Mutations tab above the plot. This will take you to a "Lollipop plot" for all mutations in TP53 across TCGA. Lollipop plots where in the protein mutations occur (x axis) and how common they are (y axis - tallest lollipop sticks are most common).
You will see that mutations at R273 are the most common across the cohort. In green, red and blue blocks the plot shows the functional domains of P53 - the parts of the protein which perform its function. Just at a glance you'll see that there are more mutations towards the right hand side of the red domain and far fewer after the blue domain.
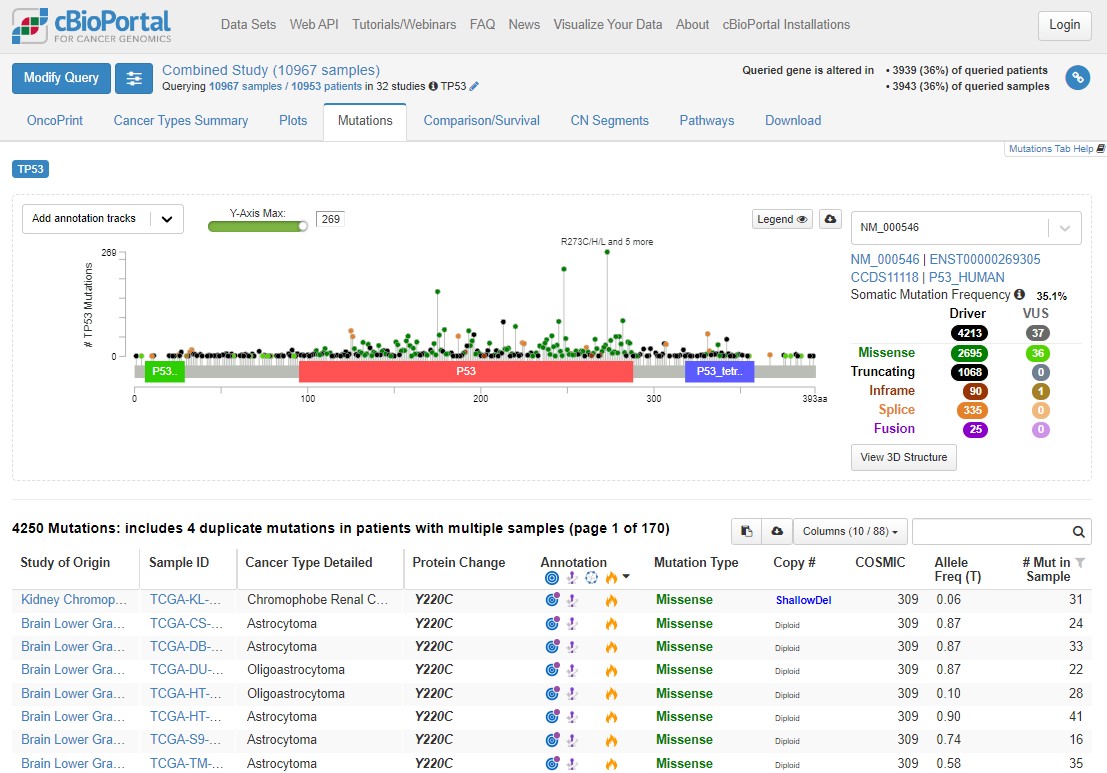
Mutations happen all over TP53, but there are some patterns which allow us to understand the biology of what P53 is doing in tumours. Dark green points represent missense mutations, where the amino acid is changing. Black points are nonsense mutations, where the rest of the protein after the mutation is truncated (creates an early stop codon).
Use the Missense, Trucating, Inframe etc. table to the right of the plot to select only Driver mutations (hover your mouse to the right of 4213 and the word 'ONLY' will appear), then select only truncating mutations. What is the distribution of these mutations? Why are truncating mutations much less common at the end of the protein (after the blue domain)?
Remove that filter and do the same for Missense mutations - what are the major differences here?
The red domain is where P53 binds to DNA. The blue domain is where P53 binds to other P53 proteins (working as a team). Missense mutations occur almost exclusively in these domains, impacting how P53 does its job. Nonsense/truncating mutations can happen pretty much anywhere, as long as they disrupt the function - that's why there are fewer after the blue domain, where a mutation is less likely to impact how the protein can function.
There is a lot of information here. Explore the plot (and the table below) further by applying different filters, hovering over mutations, annotations, domains etc. and following links to explore the known biology. After playing with the data (or if you get lost!), use this link to refresh the page back to the original plot and filters.
5 TP53 mutations and prognosis
When trying to understand the impact of mutations, we can associate the presence of a mutation with patient prognosis (i.e. how long they are likely to survive after diagnosis). Again, this helps us better prioritise research and development funding.
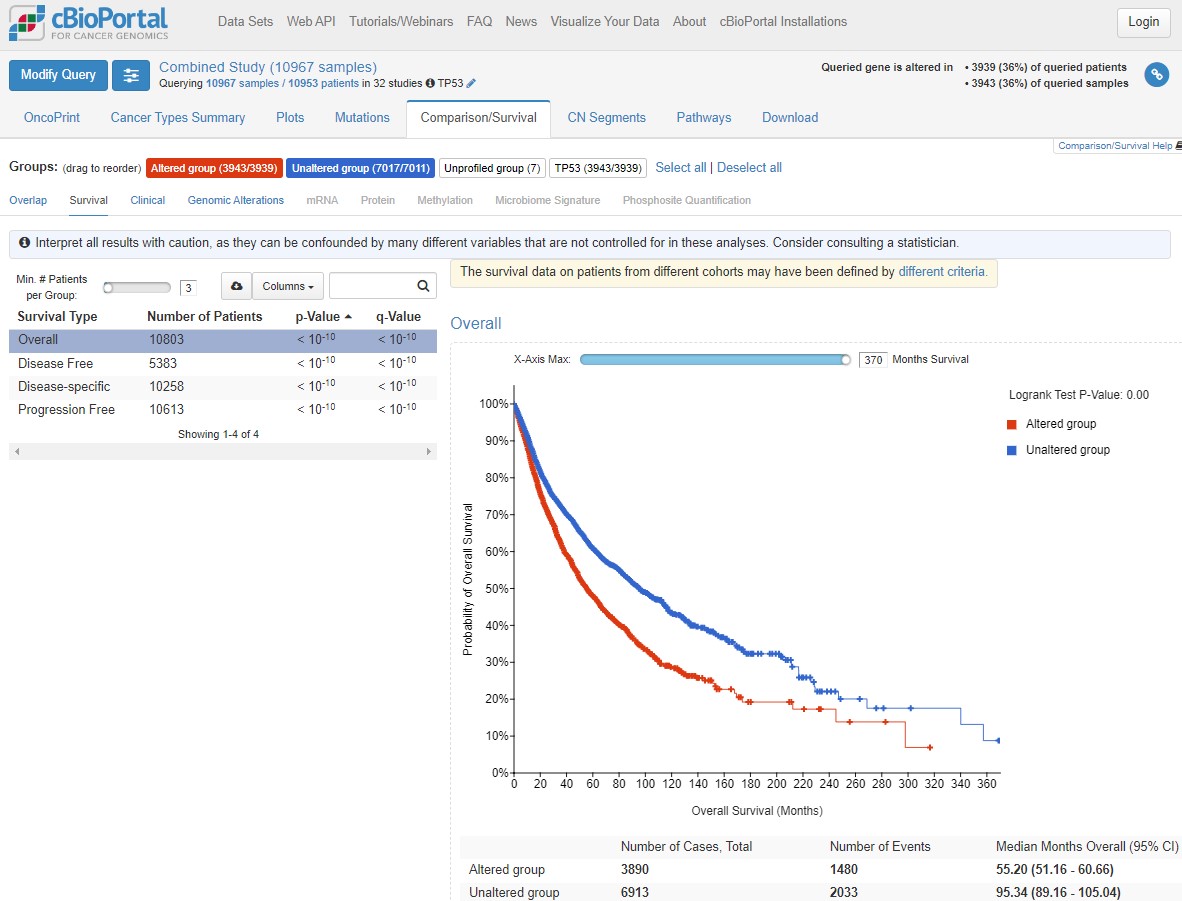
Click on the Comparison/Survival tab and then the small Survival tab which appears. This is called a Kaplan-Meier plot, and it shows the survival time of patients after diagnosis. The way to understand this plot is that patients with tumours with a TP53 mutation (red, altered group) died more quickly than patients without a TP53 mutation. If you're confused looking at the plot, visualise a line from 50% survival and see at how many months this line crosses the red and blue datasets. This is the median survival time for each group.
The x axis here goes to 30 years, but often cancer survival statistics are measured at 5 or 10 years. Try using the slider to see how survival rates change over time.
cBioPortal helpfully gives us some warnings (blue and yellow boxes). Any statistical test has assumptions and confounding variables - features which could explain differences in the data which we are not being shown here. Before scrolling past the screenshot below (where some answers are), write down 4 confounding variables which could influence how we interpret this graph. Think about how those variables could influence your conclusions.
You could have come up with some of the following ideas for confounding factors:
- Different responses in different cancers
- Different survival times in different cancers (i.e. treatment success)
- Difference in how advanced a tumour was when diagnosed
- Biological sex differences
- Severity of the TP53 mutation in that person compared to other people in the altered group
- Other mutations in TP53 mutated tumours (or in the unaltered group)
- Age at diagnosis (see how the plot shape changes with “Disease-specific” survival)
- Lifestyle factors such as weight, smoking status, economic status, employment history (think exposures)
Biology gives noisy data (unlike physics and chemistry) because there is natural variation between individuals, so there are always more confounding variables to consider. In statistics, if something is a big confounder, we can try and "control" for it during analysis.
EXPLAINER What is “big data” and is it useful?
6 TP53 mutations across different cancers
As we identified above, cancer type is a likely confounder in our understanding of TP53 mutations. TP53 is the most commonly mutated gene in cancer generally, but do you think it's mutated in all cancer types equally?
Click on the Cancer Types Summary tab. As you can see the proportion of tumours with TP53 mutations does vary a lot. In the plot, green is any kind of single nucleotide mutation, and the other colours represent copy number changes changes such as deletions.
Have a play with the y-axis value (does Counts change your interpretation? Is frequency or count more informative?), and changing from Cancer Study to Cancer Type to Cancer Type Detailed. What patterns can you see?
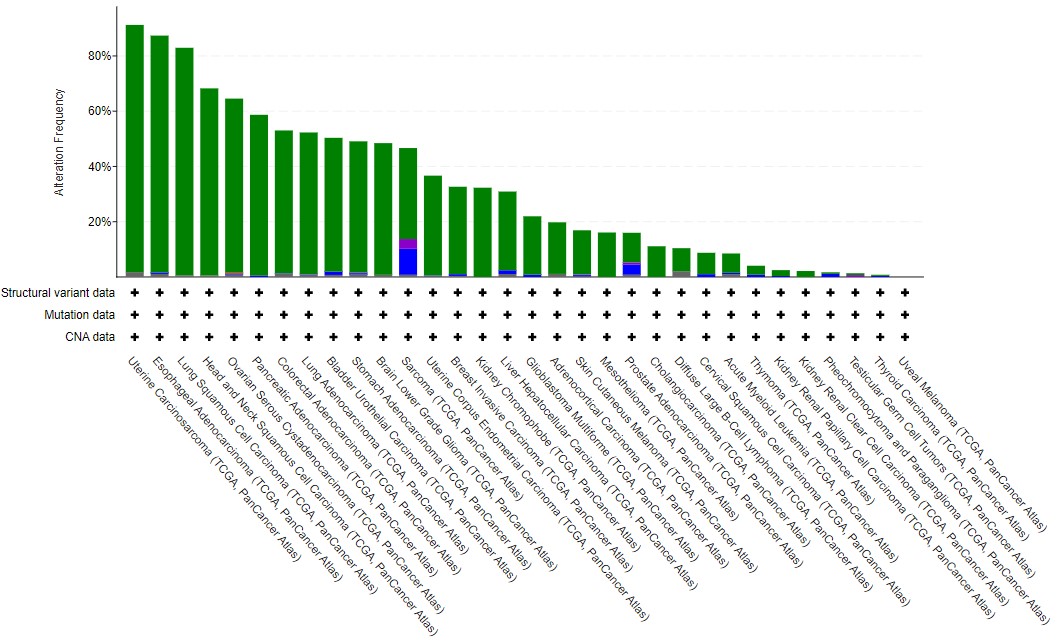
In general terms, solid cancers (rather than blood cancers) with a high mutational burden tend to have TP53 mutations - see the lung, esophageal, colorectal and bladder datasets, compared to Acute Myeloid Leukaemia or B cell lymphoma. As this is biology, there are some that bend this observation - particularly the two types of kidney cancer found in TCGA. Often, general observations hide features which are cancer-specific (and even specific to subtypes within those cancers).
This tutorial has given you an introduction to some of the power cBioPortal has for cancer research. It makes large data (usually the sole focus of bioinformaticians) accessible to laboratory scientists, students, clinicians and the general public. But, there is so much more you can find out.
Try hovering your mouse over one of the cancer type bars in the Cancer Types Summary plot and then select the study name from the box which appears. This takes you to the cBioPortal dashboard for this study - there is so much data here! Take a look about (using this link to return to the Cancer Study summary graph if needed) and see how much information there is!
If you have time, and you've enjoyed exploring cBioPortal so far, take a look at the case studies below. These give more opportunities to explore specific research questions, again focused on TP53. Remember, TP353 is important, but there are over 20,000 genes in our bodies which make proteins and over 1,000 have direct known roles in cancer - lots more to explore!
Explore the three case studies here
Concluding remarks
Large sequencing datasets like those in TCGA (and across the studies in cBioPortal) help researchers and clinicians understand cancers more broadly, and to identify likely subgroups of patients for new drugs. However, small research subgroups often get overlooked, even if those small groups represent large numbers of cancer patients every year. Imagine you identify a group of 4 cancer patients within TCGA's bladder cancer cohort (408 samples). This is only 1%, so is unlikely to get much interest from industry, eventhough it likely represents over 200 new bladder cancer cases each year in the UK alone. This is always an important thought when doing research - these data come from real people who have consented to their cancer tissue being used to help other cancer patients in the future.
Eventually sequencing will enter routine clinical practice in the UK, forming part of diagnosis and informing treatment choices, leading to truly personalised medicine. Until then we need to continue researching the role of individual molecules in cancer, the impact of mutations, and identifying or synthesising new drugs. Lots to do! Biomedical research now requires both laboratory and computational skills - and you've started down that path. Hopefully it's made you want to learn more, and maybe become a cancer researcher in the future!
Feedback
Students and teachers - thank you for taking part in this two-part exploration of TP53 mutations in cancer! We want to continue to develop and refine this joint practical and for that we need your honest feedback.
Students - please complete the feedback sheet from your teachers, and please pass on any additional comments (positive or not) back to us through your teachers.
Teachers - an honest critique would be incredibly helpful! What needs more expansion, which bits are too much?
Thank you!
Acknowledgments and Funding
The 2-part TP53 laboratory and bioinformatics practical was initially developed by Dr Simon Baker (University of York) in partnership with the STEM Learning Centre's Enthuse programme, funded by York Against Cancer. Dr Andrew Mason (University of York) developed and expanded the cBioPortal bioinformatics practical while Simon spent weeks in the laboratory developing the restriction enzyme practical and making sure there was enough DNA for all the students to work with! Simon and Andrew are very grateful to the teachers and students at Malton School, Huntington School and Selby High School for being willing first participants in this project - thank you for coming at it with an open mind.
Simon and Andrew work in the York Against Cancer-funded Jack Birch Unit at the University of York. Simon is a Kidney Research UK Intermediate Fellow and Andrew is a Lecturer in Cancer Informatics funded by the Department of Biology who develops data and bioinformatic educational material in partnership with Elixir-UK.
Case Studies for expanding your knowledge of cancer biology
We are now going to explore mutations in TP53 and other genes in three cancer case studies. At the end of the core session we started to introduce whether or not TP53 mutations were common in all cancers, or whether there was variability. As we're working with biological data, there is a lot of variability!
Start to think about why that might be. P53 regulates cell proliferation and cell death. Tumours need to escape P53 activity. But is mutating P53 the only way for a tumour to do this? And is regulating proliferation and cell death the only way for a tumour to form? Clearly not, because not every tumour has a TP53 mutation, and tumours have a large number of ways to evade detection and eradication in the body.
In his epic (third) review of the Hallmarks of Cancer published in 2022 (download the PDF here), Professor Douglas Hanahan outlines the different physiological features a cancer must overcome (image below). These are all areas where cancers can effect change on the body in order to survive. Remember, a cancer is under the pressures of evolution in just the same way as an infectious virus, a herd of giraffes, or us - just on a different scale.
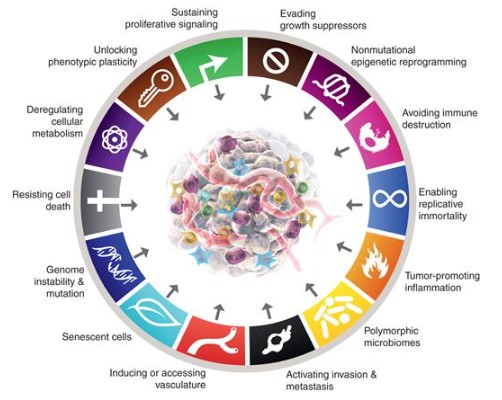
In the 3 case studies below we're not going to cover all of it! But we are going to touch on different cancer mechanisms, proteins working together in pathways and how that creates redundancy or co-dependence, and different routes for cancers to form.
Take your time. Explore the data with the skills you learned in the core session. If you have questions or want to discuss what you're doing further, just ask your teacher for our contact details. We're only scratching the surface here - hopefully we've inspired you to keep asking more questions.
A) Sarcoma - multiple hits to the P53 pathway
Return to the Cancer Study summary graph.
On the Cancer Types Summary graph, hover over the Sarcoma bar on the chart and click on Query this study for TP53. Now focused on this one study, look at the OncoPrint, Mutations and Comparison/Survival tabs - what do you observe in Sarcoma compared to all cancers from TCGA?
Interestingly, eventhough TP53 mutations are very common in Sarcoma, and the mutations are spread across the protein as before, there is no significant difference in survival.
In biology, proteins rarely act on their own, instead forming pathways with other proteins and molecules to complete functions. Select the Pathways tab.
The top pathway is the eponymous P53 pathway, with TP53 at the centre promoting (arrow) senescence (ageing) and apoptosis (cell death), and inhibiting (flat arrowhead) growth and proliferation.
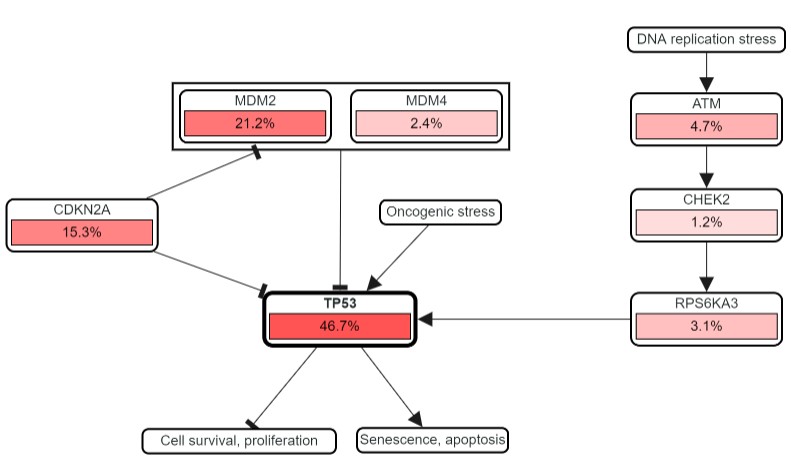
The percentages show how frequently each gene in the pathway is mutated in Sarcoma. TP53 mutations are common, but so are those in CDKN2A and MDM2 - both of which negatively regulate P53. The question is, why mutate other genes in this pathway, particularly if they help to limit the regulatory role of P53? Is this what is actually happening? Let's find out.
At the top of the page, under Sarcoma (TCGA, PanCancer Atlas), click on the pencil symbol next to TP53. Add MDM2 and CDKN2A to the list and Submit Query.
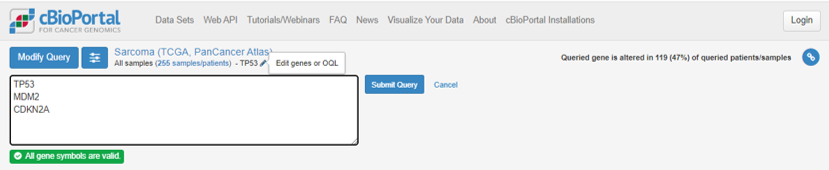
Remember that TP53 was mutated in 47% of Sarcoma cases, but the percentage of tumours with a mutation in at least 1 of TP53, CDKN2A and MDM2 is now 74%. What does this suggest? Head to the OncoPrint tab again - what does this show?

MDM2 is almost never mutated in tumours where TP53 is mutated. This is called mutual exclusivity - simply put, if you have a mutation in one, you don't in the other. Remember in the pathway that MDM2 was seen to inhibit TP53, and the mutations we get in MDM2 are all amplifications - generating more MDM2 protein, and having a bigger inhibtory effect on P53 activity.
The picture is more complicated with CDKN2A but there is little overlap with MDM2 mutations, and most of the TP53 overlap is when there is a missense, change/gain of function in P53 (dark green), rather than a truncating mutation (black).
The importance in tumour biology here is that in 74% of Sarcoma samples, the P53 pathway is being broken. This is happening in multiple ways with the cancer using different mutations. This means that in Sarcoma, we can't just use TP53 mutations as a marker of altered P53 biology - we should use all three genes in tandem.
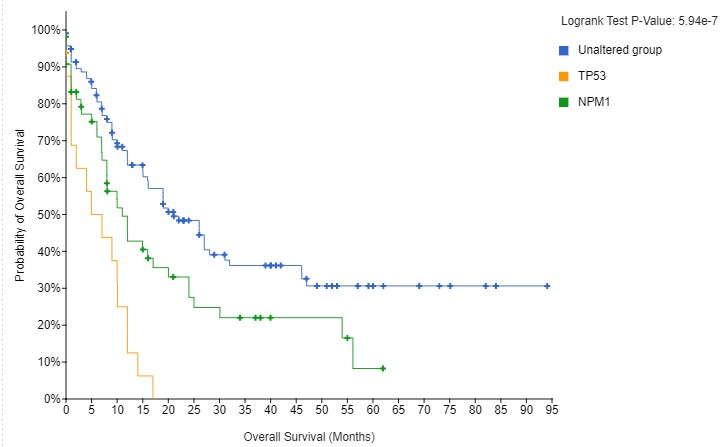
Now, go back to the Comparison/Survival tab, then the Survival tab. The altered group (a mutation in any one of the three genes) now has much worse survival than the unaltered group, reflecting the negative impact of breaking the P53 pathway, not just breaking P53 itself.
The video below is a walkthrough and explainer for this case study.
Return to core session concluding remarks
B) Acute Myeloid Leukaemia - different cancer mechanisms
Return to the Cancer Study summary graph.
We're now going to explore the AML dataset. TP53 is not mutated very commonly in AML - only 9% of cases. Hover over the green bar and query the study as before. Look through the usual tabs. Interesting to note there are so few mutations that the lollipop plot (Mutations tab) doesn't really suggest any hotspot mutations in AML. However, the survival of TP53 mutated tumours is far worse.
AML is a blood cancer and actually exhibits a very low number of mutations in each patient compared to solid cancers such as lung, breast, prostate, colon or bladder. However, AML does exhibit a very striking hotspot mutation in the NPM1 gene. Add NPM1 to the query list using the pencil icon again, and submit.
Straight away you can see that mutations in NPM1 and TP53 are mutually exclusive. Check out the Mutations tab, and see what the hotspot mutation is in NPM1.
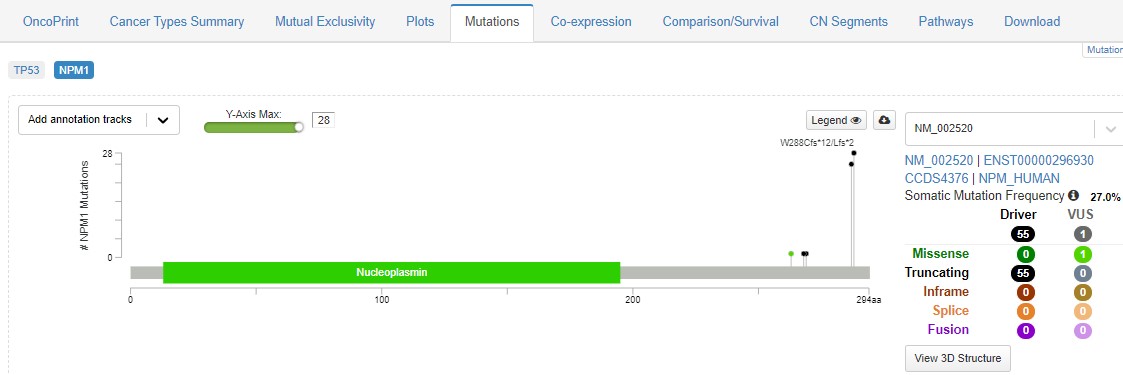
Eventhough this hotspot happens right at the end of the protein, it causes it to be expelled from the cell nucleus, so it is unable to perform its normal role. Explore the usual tabs - what feature of cancer biology can you find?
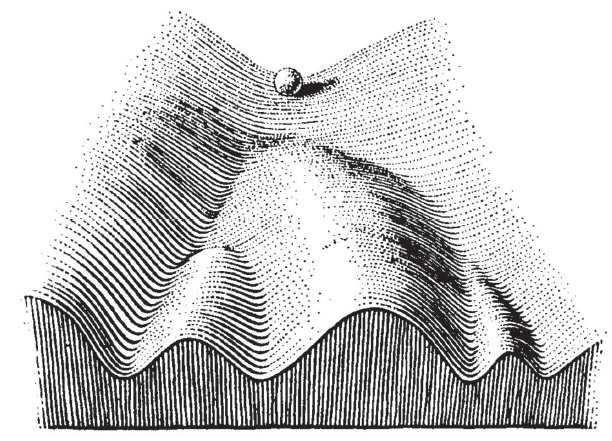
The striking differences in survival are interesting, particularly as there is no obvious cooperative or antagonistic link between P53 and NPM1 function, as there was within the P53 pathway in the Sarcoma example above. The biological reason here is that mutations in TP53 and NPM1 send tumours in different directions. Early differences in mutation status govern the biology of the tumour. Different people may be predisposed to certain mutations, or may have had different exposures. In his 1957 book The Strategy of Genes the researcher C. H. Waddington used an image that has become famous in evolutionary, developmental and cancer biology, see below. As the ball runs down the slope, there are a series of choices. In our example, a TP53 mutation sends the ball one way, an NPM1 goes the other. Understanding the differences in the choices, and how they cause different tumours, is key for developing more personalised medicine.
The video below is a walkthrough and explainer for this case study.
Return to core session concluding remarks
C) Head & Neck Cancers - different cancer causes
A quick final case study to highlight some of the clinical data you can access through cBioPortal. Make sure you use all the skills you've gained so far to explore mutation type, pathways, and other cancer features. Select the Head and Neck Squamous Cell Carcinoma (HNSC) dataset, and query for TP53 as before.
HNSC has two well-associated causes: smoking and infection by HPV (Human Papillomavirus - the same as in cervical cancer). Both induce large numbers of mutations in DNA, but smoke carcinogens and viruses cause very different types of mutations. These mutational signatures can be used to try and understand the causes of cancer. As an aside, Dr Simon Baker (who led the laboratory practical) is researching a potential viral cause of bladder cancer in his work supported by the local charity York Against Cancer - see their blog on his work here. Anyway. Back to HNSC.
After exploring the usual tabs, click on the Comparison/Survival tab, and then the Clinical tab. The first row should be Subtype, with the graph showing that HNSC tumours with TP53 mutations are most commonly negative for HPV. This could reflect different mechanisms for HNSC, either driven by changes in TP53 or the HPV infection. But this also creates a major confounding factor.
Click on Head and Neck Squamous Cell Carcinoma (TCGA, PanCancer Atlas) at the top of the page and this will open a new tab with all the information on the HNSC cohort. This shows just how much information there is available through cBioPortal - it is a truly staggering resource for the cancer research community (and the wider public!).
Scroll down to the Subtype pie chart, hover and select the HPV+ and HPV- groups, ignoring the NA (where is no information on infection status), and click the Compare button. On the Survival tab, you can see that indeed, HPV positive tumours have better survival on average - so this was a confounder for the TP53 comparison.
Finally, select the Genomic Alterations tab. This performs a comparison of the mutations enriched in either subgroup. TP53 is there, as are genes in the P53 pathway, enriched in HPV negative tumours. The first gene enriched for mutations in HPV positive tumours is TRAF3, a gene involved in immune defence against viruses, which is commonly deleted in HPV positive tumours.
The video below is a walkthrough and explainer for this case study.
Return to core session concluding remarks
Core session walkthrough
The video below is a walkthrough of the core exercises outlined above for the exploration of TP53 mutations in over 10,000 samples of The Cancer Genome Atlas.
Return to tutorial introduction.
Explainers
cBioPortal explained
cBioPortal is a public website which includes data from thousands of cancer studies. These data include clinical information such as survival status, tumour stage and grade, age at onset, recurrence and sex, as well as multiple different types of processed sequencing data. The majority of sequencing data are for gene expression (the activity of genes in the cancer), specific mutations (small genetic changes) and large genome structural changes, such as differences in the number of gene copies (away from the usual 2).
cBioPortal doesn't just include data from cancers, but also cancer cell lines - experimental models used in laboratories to represent types of tumour. Cancer cell lines are essentially immortal dishes of cells which are used as standard references across cancer research. Patient tumours are a more biologically and clinically relevant resource, but they require access to (and consent from) patients.
cBioPortal can be used as a first point of reference for cancer researchers to understand the broader relevance of the results they have from their own laboratory or bioinformatic experiments. It can be used to visualise and statistically interpret data, as well as generate new hypotheses. One of the key aspects of science is someone else being able to find the results that you have (reproducibility) and sharing and building upon the work of others. cBioPortal is the biggest resource for doing this (and it's free!).
Sequencing explained
Sequencing is the name for a group of technologies scientists can use to read the order of bases in DNA and RNA. This allows us to find mutations, quantify how much DNA or RNA is in a cell or tissue, and to understand how DNA is structured in a cell (and what it might interact with - proteins, other bits of DNA etc.).
As DNA and RNA replicate by using themselves as a template, scientists have developed tools to copy this natural process to read the sequence of bases for themselves. In essence, pieces of purified DNA are stuck to glass slides (like microscope slides), melted apart to leave only one half of the double helix, and then new DNA bases are added. These added bases are modified so that they glow when they have formed a new base pairing. For example, if the stuck piece of DNA has a C, a G would base pair with it. This would then flash a colour, a camera takes a picture, then the next base is added, and so on. This process is now very fast, with some machines able to sequence 136 billion DNA bases per hour! Back in the 1990s none of this was automated and it could take several years to sequence only a few thousand bases!
Scale is one area where sequencing has changed. As scale has gone up, cost has come down. The draft version of the first human genome cost $150,000,000.00 to produce. By 2008 this had dropped to $1,000,000.00. By 2020 it was less than $1,000.00. This is why sequencing is now entering clinical practice. The next thing to solve is the huge amount of raw data sequencing produces.
The Cancer Genome Atlas explained
The Cancer Genome Atlas (TCGA) was a landmark cancer omics programme launced by the US National Institute for Health National Cancer Institute in 2006. The aim was to characterise primary cancer samples from over 30 cancer types of extreme need (either by prevalence or poor prognosis) using multiple different sequencing technologies. In 2006 many of these technologies were in their infancy, or barely even functional, but the programme generated over 2.5 petabytes (1PB = 1,000,000GB) of multiomics sequencing data with extensive matched pathology and clinical metadata.
The lasting requirement was that the processed data would be made readily available (through cBioPortal and other sites) for the entire research community. The raw sequencing data (which is identifiable to the inidvidual) can also be accessed under strict data privacy regulations.
You can read more about TCGA and its legacy here.
Gene and Protein naming explained
Traditionally speaking, genes were named after what happened when scientists broke them. In fruit flies you can guess what wingless and tailess do. Then scientific "humour" took over. tinman is for a gene necessary for heart development; cheapdate was a mutant found in flies that had a very low tolerance to alcohol.
In higher animals, like ourselves, gene naming became more conventional, describing the function of the encoded protein. However, people discover more functions over time, or realise that the protein wasn't actually doing that job. Some names were not really very descriptive, such as TP53 for tumour protein 53. Various international organisations have since tried to standardise and rename gene names to make them clearer. However, this doesn't mean gene names and their eventual proteins are called the same - take TP53 and p53 as a clear first example.
There is usually a decent association, and in lots of cases now a gene's name is fairly indicative for what its protein does. The standard (for human genes) is that gene and protein names are all in capital letters, but that a gene name is in italics, whereas a protein name isn't. Conventions are different between species. In mice, the italics vs not is the same, but only the first letter is capitalised.
Mutations explained
The human genome is over 3 billion base pairs in size, but only about 1% of the DNA is directly responsible for the sequence used to make proteins. Some of the other 99% is important for regulating how the 1% is used, but the key point is that lots of the genome can be mutated without much impact on the host. So which mutations are likely to cause problems in cancer?
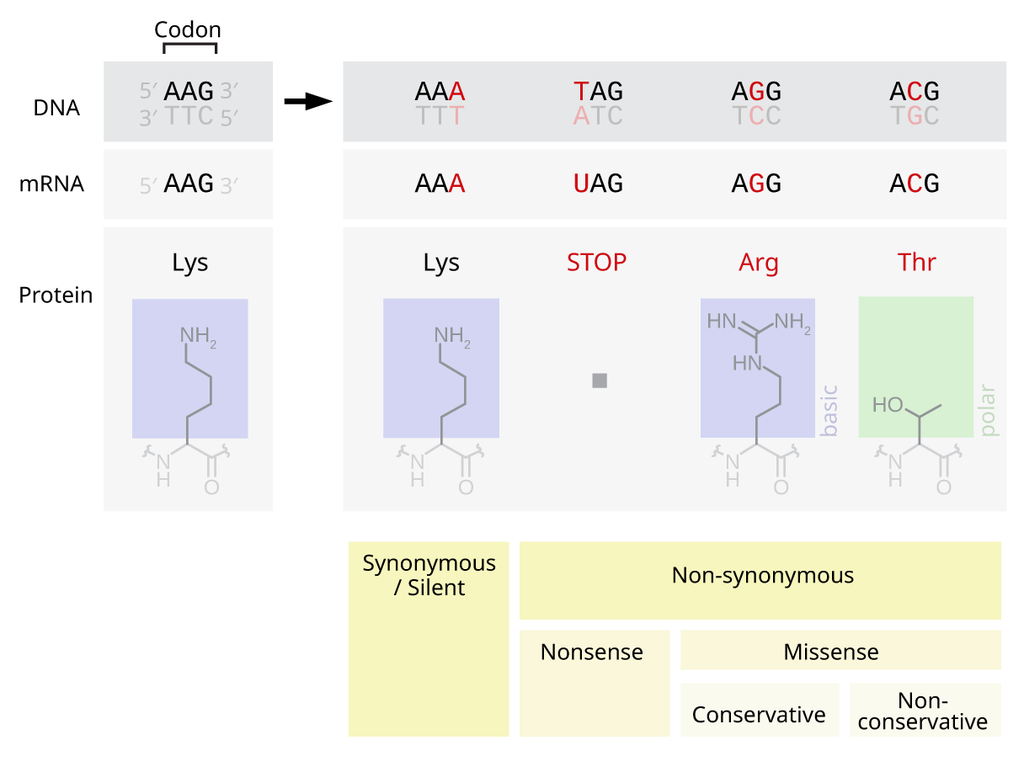
Mutations within protein-coding genes are the easiest to understand. If a mutation doesn't result in an amino acid change, this is a silent ("synonymous") mutation. There is usually no (big) impact for these.
When an amino acid does change, this is called a non-synonymous mutation. These include nonsense mutations (where a STOP codon is created, truncating the protein) and missense mutations (where the amino acid is changed). When and where these mutations happen determine how much on an impact there could be. Proteins are not just long strings (usually), but fold up, interact with other parts of the protein and create "functional domains" - regions of the protein that actually do things, like bind DNA, or catalyse a substrate etc.
If a truncating nonsense mutation happens towards the start of the protein, it is more likely to stop that protein from performing its function. It could be that a nonsense mutation right at the end is still problematic, if there is a domain right at the end which is important (such as an anchor for tethering a protein within a cell membrane).
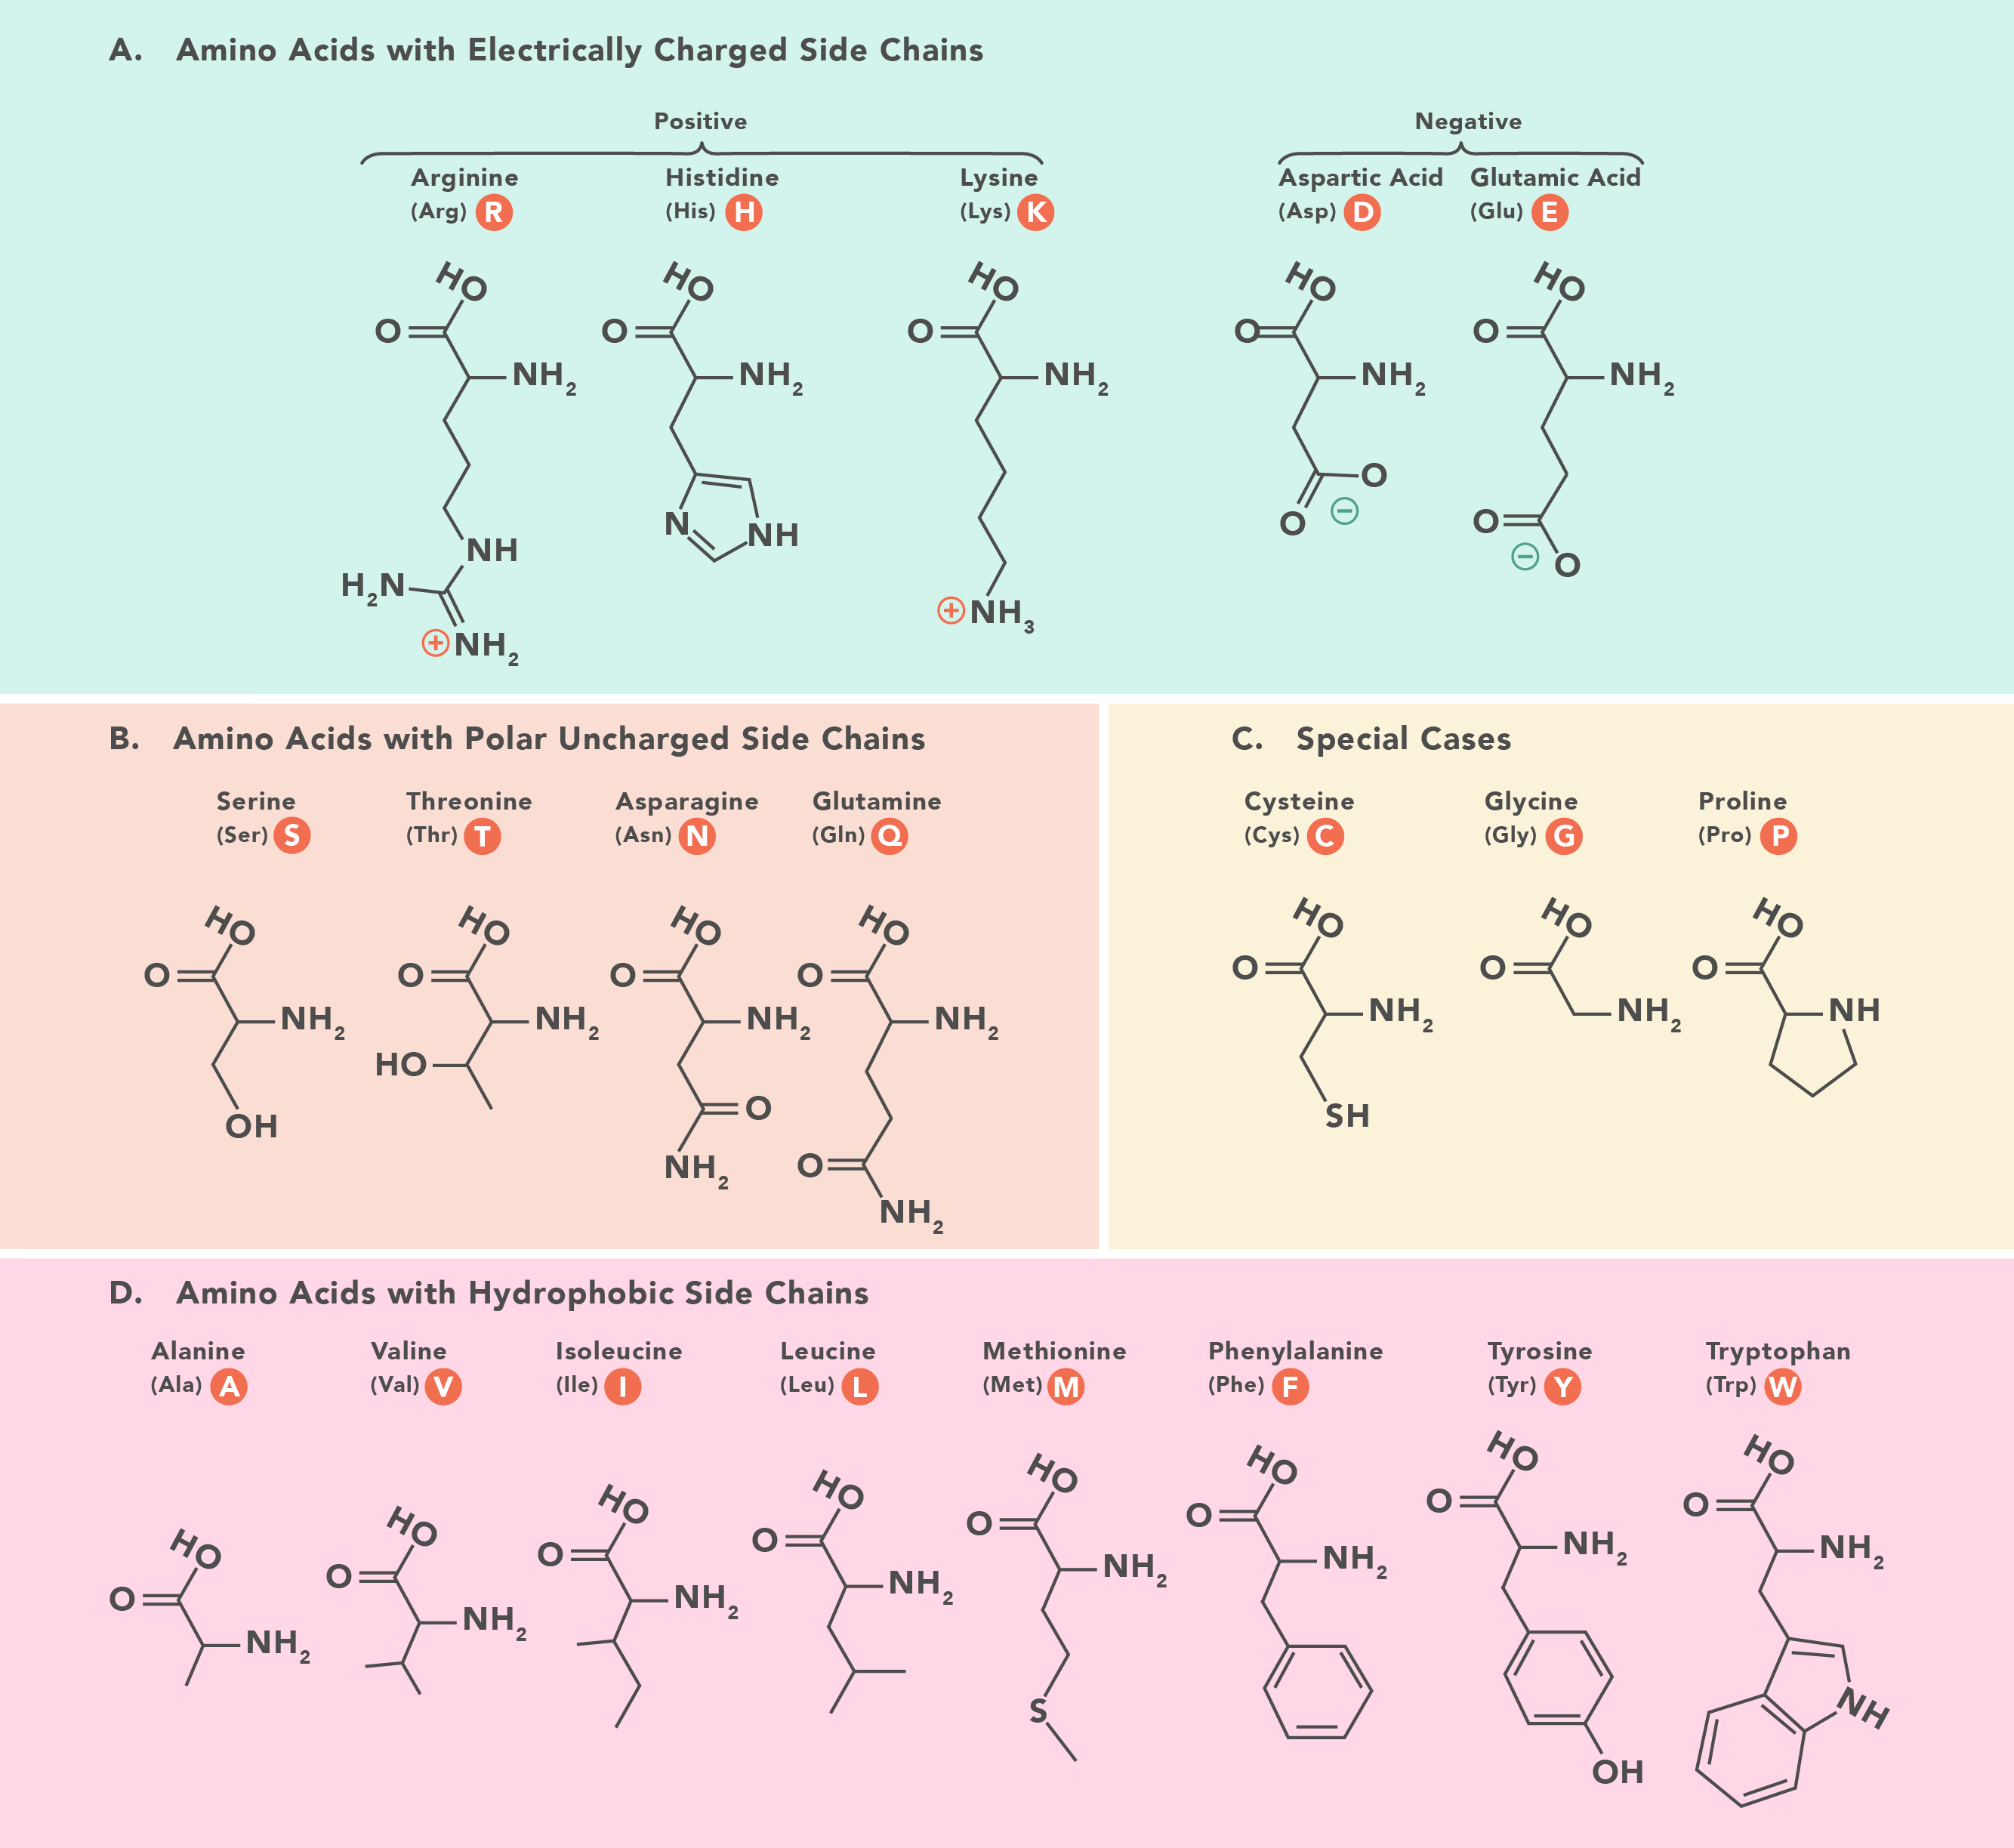
Missense mutations can be trickier to understand, as the impact often depends on how different the chemistry is of the new amino acid. Amino acids have the same backbone structure, but then have special side chains which make them different. These side chains are often important for protein function and/or protein shape. For example, the backbone of DNA is negatively charged. If you change a positively charged amino acid, such as Lysine, for a negatively charged one, such as Glutamic Acid, it's possible the protein will no longer interact with DNA properly. Similarly, if a small amino acid like Glycine changes for a huge one like Tryptophan, it's possible the shape of the entire protein will change. Other special cases exist, such as mutations which result in a cysteine. Cysteine residues form bridges with other cysteines, holding proteins together (these are the bonds being broken in curly hair when you apply heat using straighteners) - either different parts of the same protein, or between different proteins.
Often we can predict the impact of a missense mutation, but it may need to be checked experimentally.
Truncating mutations usually break a protein, stopping its function. Missense mutations can either break a protein or change its function (new interactions or activity etc.). In both cases it is possible that the change has little effect. This is really important in cancer as we want to find important "driver" mutations - the ones which lead to the cancer starting or becoming more aggressive - and ignore the "passenger" mutations which are just happening because cancers often have highly mutated genomes. There are many more passengers, so it is important to work out which is which. This can be done experimentally, or by using large datasets like those in cBioPortal to see which genes and amino acids are being mutated a lot, or in specific locations - like TP53.
These studies also help us find out if a gene is a tumour suppressor or an oncogene. Tumour suppressors do what you think - they limit processes like proliferation and growth, and when they're broken these processes go out of control. An oncogene is a gene which promotes cancer, and oncogenic mutations are ones where protein function changes, making cancer more likely. Tumour suppressors are usually easy to spot, because they just get broken a lot. Oncogenes are trickier if you don't know the potential impact of a mutation. Some genes, like TP53 can have both functions. Truncating P53 mutations stop the protein from limiting proliferation, but oncogenic missense mutations like R273H from the practical, change how P53 interacts with DNA, modifying its normal function.
Mutations in different classes of genes also have different levels of impact. Breaking a structural protein might have a limited impact compared to changing hormones, receptors or proteins which regulate other genes. This is where cancers with with relatively few mutations (such as in AML) can still have large changes in the cancer. We haven't even talked about mutations outside the gene regions, or copy number changes - these can have a huge impact too. We just know the most about coding changes.
The Problem with Big Data explained
"Big data" is a buzz phrase you hear a lot at the moment. It means as it sounds - lots and lots of data, about whatever. In biology it typically means either large amounts of sequencing data, or large amounts of high resolution images.
In both cases, there are issues with storage, security, ethics, sharing, accessibility, reusability etc. etc. But, these are incredibly rich resources for generating new questions, testing the broad applicability of existing research, and training new machine learning approaches for understanding the complexity of biology.
In sequencing studies this meant the development of a largely unused specialty in biology - computer science - leading to bioinformatics as a field of research. This has led to lots of infrastructure and knowledge development, but many Biologists do not put their Maths head on in the morning. Increasigly this is changing, but Biologists can often fall into data holes. We all need to be careful on how we interpret results of data and whether they are significant - both statistically and biologically. This is very important with very big data, as even tiny changes between groups can appear mathematically significant.
Always graph your results. Always think whether they make sense. Always try to see what could be confounding your conclusions!