Introduction to cBioPortal

cBioPortal is a publicly available online resource for cancer genomics, with omics and clinical data available for many cancer types. In this 90 minute session we will introduce cBioPortal - what's there, how to use it, and what you can learn from it. We will then have some led problem solving activities to get to grips with the website, and finish with tips and advice for how you can use the data, plus a demonstration of how you can link to cBioPortal programmatically using R. All this material will be maintained for future reference.
You can download the slide deck for the workshop here as a PDF or Powerpoint (pptx).
There are embedded videos for the cBioPortal website demo, the end of the TP53 problem-solving exercise and the cBioPortal API and MAFtools demo.
Learning objectives
- Recognise the applications and utility of cBioPortal for cancer research
- Operate and explore the cBioPortal website to identify cancer data of interest
- Complete two cancer biology problem-solving tasks using cBioPortal
- Recognise the process for accessing and analysing cBioPortal data
Session outline
12.30 Zoom room opens and welcoming remarks
12.35 Introduction and Learning Objectives
12.45 cBioPortal website demo
12.55 Problem-solving tasks
13.30 Recap and Further Resources
13.35 Accessing and using underlying cBioPortal data
13.45 RStudio demo for accessing cBioPortal data
13.55 Summary and final remarks
14.00 Close
The Session
Introduction and Learning Objectives
cBioPortal website demo
During the session this is a live demonstration of the cBioPortal functionality, covering the available datasets, then using TCGA Bladder Cancer (Cell 2017) data to investigate: the summary and clinical dashboard tabs, a single- and then multi-gene query. Both gene queries are used to epxlore oncoprints, lollipop plots, plotting functionality and survival.
The video below is an indicative recording of a cBioPortal demo.
Problem solving tasks
Now you've seen what cBioPortal is and the kinds of data available, it's time to explore! In the guided examples below, follow the instructions and think about the questions posed - how is the data able to support your conclusions, and what caveats must you consider?
Below there are two main tasks for you to complete. As this session is over Zoom, asking questions feels a bit trickier! But we have provided a Google Form for Questions. Andrew will answer these as they appear.
Task 1 - the pan-cancer importance of TP53 mutations
This first task covers TP53 mutations across the 32 different cancer studies of The Cancer Genome Atlas, an enormous international study to better understand the diversity of genetic changes in over 10,000 cancer patients. TP53 is one of the most commonly studied genes in cancer as it is known as the "Guardian of the Genome". It is also very commonly mutated, as you will see.
Open up any web browser and head to www.cbioportal.org
The home screen (pictured below) gives immediate access to results from sequencing data generated from thousands of cancer samples from all over the world. Scroll down the list. Each study represents potentially years of work from doctors, surgeons and nurses in hospitals to recruit patients, work with families and collect samples, and then from biomedical researchers in universities to process the samples, then generate, analyse, interpret and publish the results.
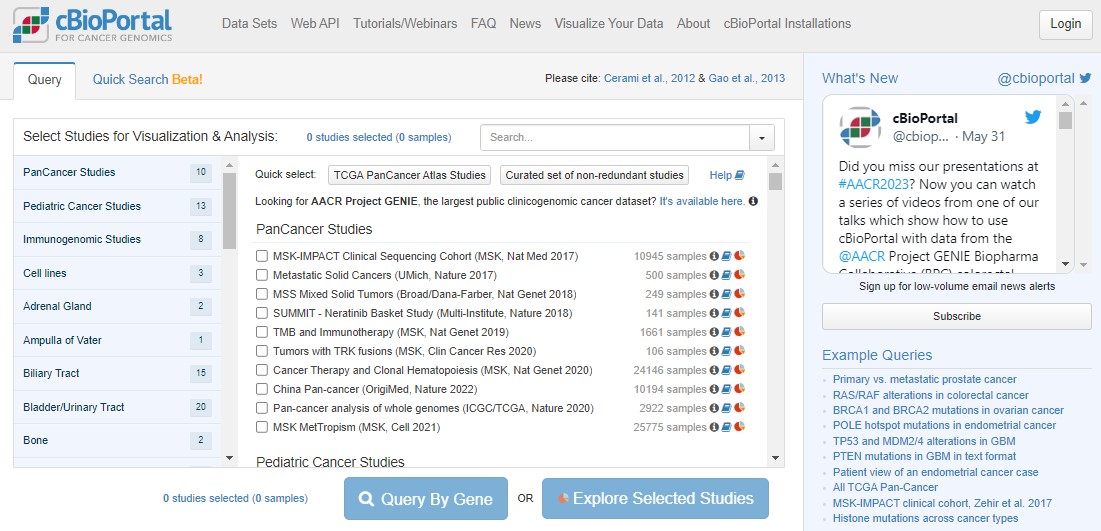
Return to the top of the cBioPortal homepage. We're going to work with The Cancer Genome Atlas (TCGA) pancancer study. "Pan" in this context just means "across lots of different cancers".
Click the Quick select link for TCGA PanCancer Atlas Studies. You have just loaded data for 32 different cancer studies and 10967 samples coming from 10528 different people! Next, click on the blue Query By Gene button, scroll to the bottom and type TP53 into the Enter Genes box, then Submit Query.
Lots of colours! Don't panic. An OncoPrint is a big summary of mutation data - is there a mutation in a particular sample, and what type of mutation is it? In an OncoPrint each column represents a single sample. You have loads of samples, so everything is very squished.
You can largely ignore the three "Profiled for..." rows - these just indicate which sequencing technologies were used on those samples. For example, you'll see a large number of glioblastoma samples were only profiled for copy number changes, not mutations or structural changes.
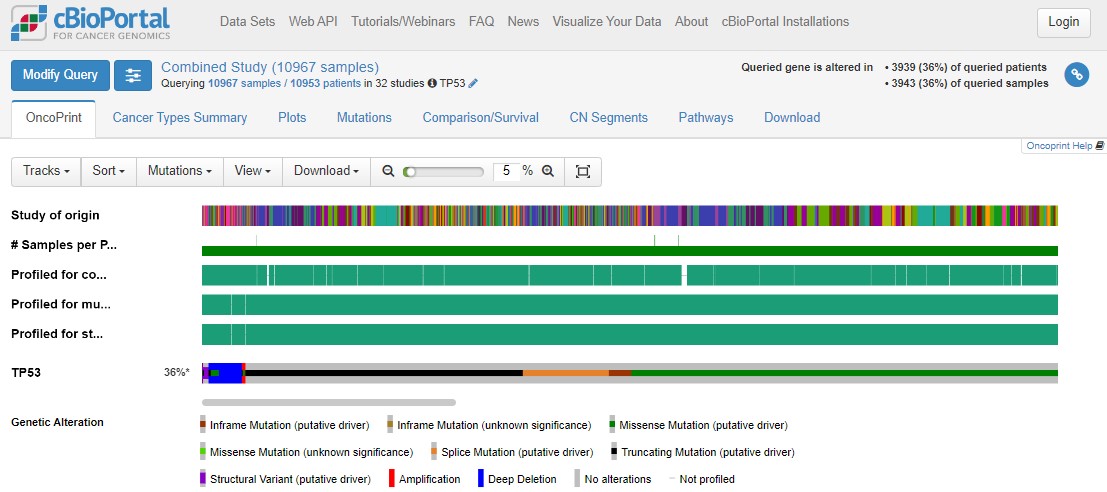
Use the zoom slider to go to 1%, then you can see the whole cohort, and see that TP53 is mutated in 36% of the queried samples. Some patients have multiple samples, hence the disparity in patient/sample numbers (top right).
Use the zoom slider or the mouse (click and hold to draw a small box over the OncoPrint) to zoom right in on a small number of samples. Hovering over individual samples gives more information such as the number of samples per patient (usually 1), the tumour study (top row) and the specific mutation(s) in a patient (bottom row). Some mutations have symbols attached to show any information we might have on what that mutation does. A blue target suggests it is oncogenic (i.e. important in cancer). Flames show it is a hotspot mutation (i.e. mutated in lots of people). Sometimes mutations can be tolerated by cells, or we simply don't know yet if that specific mutation impacts how the protein works.
A potentially new concept for you will be copy number changes. This literally means how many copies of each gene a person has in every cell in their tumour. In healthy cells we should have 2 copies of every gene (as we are diploid organisms), with some exceptions when genes are found on the X/Y chromosomes. In cancers the genome can be very unstable and this can lead to deletions of some parts of the DNA, or amplifications where you get more than 2 copies of genes. This can have a huge impact on tumour biology!
With TP53, nonsense mutations are important (where cancers break the P53 proliferation brakes), but the same effect happens from a deep deletion of TP53 (where the brakes get totally removed). This is a really important concept in cancer biology: different types of mutations can have the same impact on tumour biology. This can mean that the same drug can be given to people with different mutations, such as P53 mutations R175H, R248Q, R273C, R273H, R273L and R282W, as these mutations all change how P53 binds to DNA.
Click on the Mutations tab above the plot. This will take you to a "Lollipop plot" for all mutations in TP53 across TCGA. Lollipop plots where in the protein mutations occur (x axis) and how common they are (y axis - tallest lollipop sticks are most common).
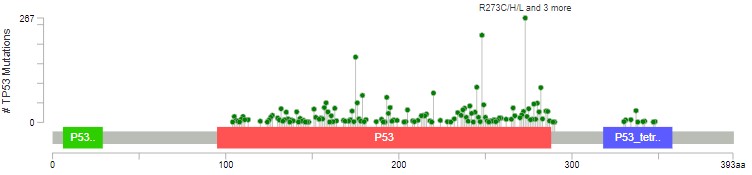
You will see that mutations at R273 are the most common across the cohort. In green, red and blue blocks the plot shows the functional domains of P53 - the parts of the protein which perform its function. Just at a glance you'll see that there are more mutations towards the right hand side of the red domain and far fewer after the blue domain.
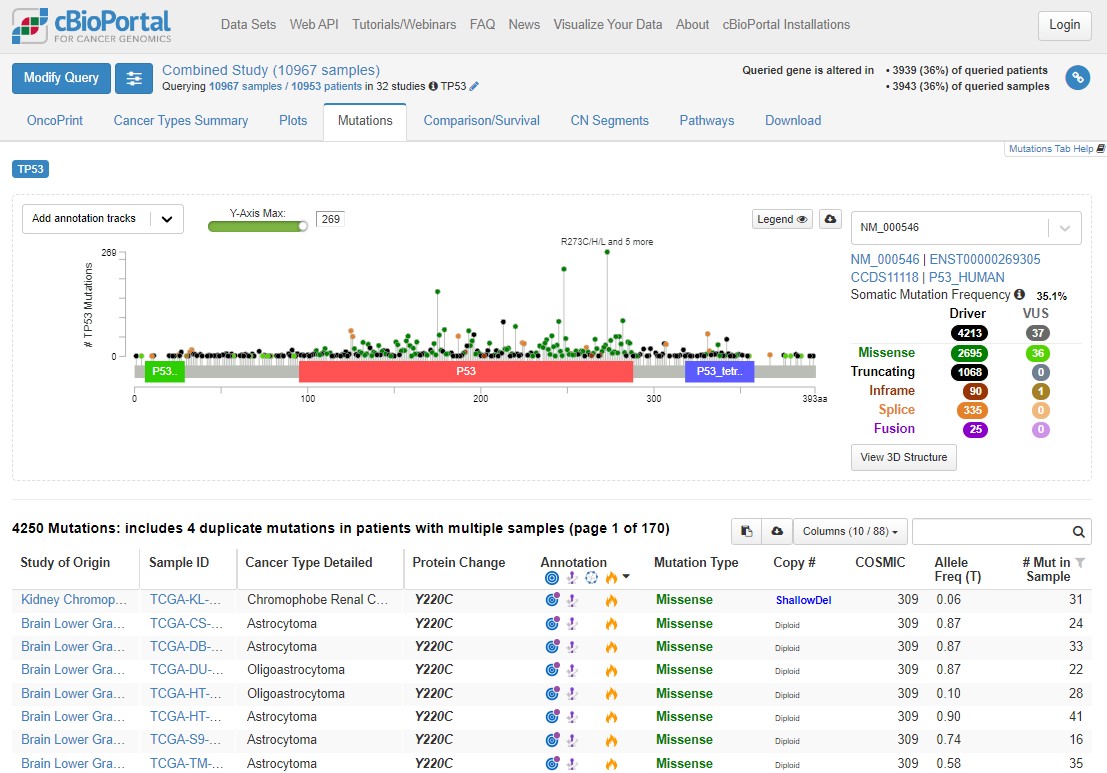
Mutations happen all over TP53, but there are some patterns which allow us to understand the biology of what P53 is doing in tumours. Dark green points represent missense mutations, where the amino acid is changing. Black points are nonsense mutations, where the rest of the protein after the mutation is truncated (creates an early stop codon).
Use the Missense, Trucating, Inframe etc. table to the right of the plot to select only Driver mutations (hover your mouse to the right of 4213 and the word 'ONLY' will appear), then select only truncating mutations. What is the distribution of these mutations? Why are truncating mutations much less common at the end of the protein (after the blue domain)?
Remove that filter and do the same for Missense mutations - what are the major differences here?
Driver missense mutations are exclusively found in the functional domains, and not elsewhere in the protein.
The red domain is where P53 binds to DNA. The blue domain is where P53 binds to other P53 proteins (working as a team). Missense mutations occur almost exclusively in these domains, impacting how P53 does its job. Nonsense/truncating mutations can happen pretty much anywhere, as long as they disrupt the function - that's why there are fewer after the blue domain, where a mutation is less likely to impact how the protein can function.
There is a lot of information here. Explore the plot (and the table below) further by applying different filters, hovering over mutations, annotations, domains etc. and following links to explore the known biology. After playing with the data (or if you get lost!), use this link to refresh the page back to the original plot and filters.
When trying to understand the impact of mutations, we can associate the presence of a mutation with patient prognosis (i.e. how long they are likely to survive after diagnosis). Again, this helps us better prioritise research and development funding.
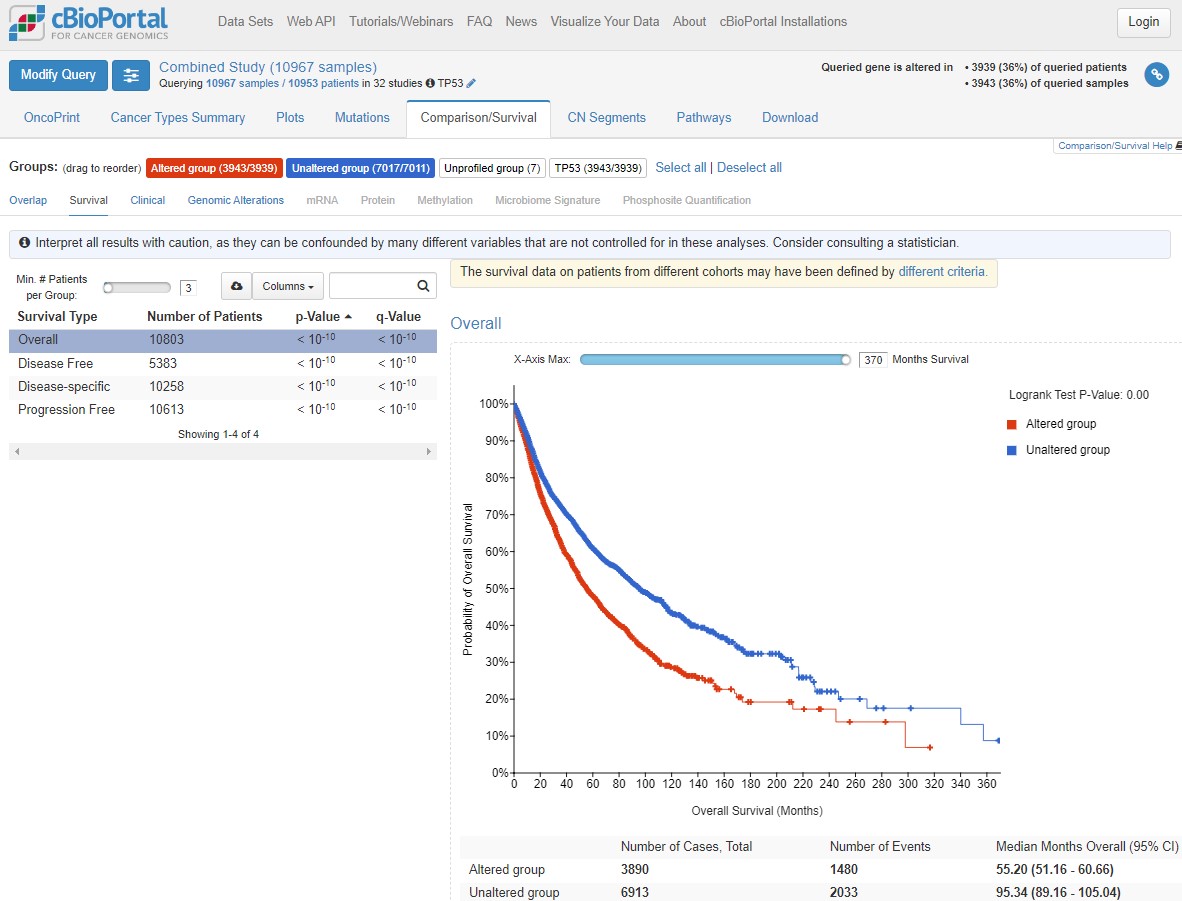
Click on the Comparison/Survival tab and then the small Survival tab which appears. This is called a Kaplan-Meier plot, and it shows the survival time of patients after diagnosis. The way to understand this plot is that patients with tumours with a TP53 mutation (red, altered group) died more quickly than patients without a TP53 mutation. If you're confused looking at the plot, visualise a line from 50% survival and see at how many months this line crosses the red and blue datasets. This is the median survival time for each group.
The x axis here goes to 30 years, but often cancer survival statistics are measured at 5 or 10 years. Try using the slider to see how survival rates change over time.
cBioPortal helpfully gives us some warnings (blue and yellow boxes). Any statistical test has assumptions and confounding variables - features which could explain differences in the data which we are not being shown here. Before scrolling past the screenshot below (where some answers are), write down 4 confounding variables which could influence how we interpret this graph. Think about how those variables could influence your conclusions.
Are your confounding variables in this list? Did you think of others?
Different responses in different cancersDifferent survival times in different cancers (i.e. treatment success)
Difference in how advanced a tumour was when diagnosed
Biological sex differences
Severity of the TP53 mutation in that person compared to other people in the altered group
Other mutations in TP53 mutated tumours (or in the unaltered group)
Age at diagnosis (see how the plot shape changes with "Disease-specific" survival)
Lifestyle factors such as weight, smoking status, economic status, employment history (think exposures)
Biology gives noisy data because there is natural variation between individuals, so there are always more confounding variables to consider. In statistics, if something is a big confounder, we can try and "control" for it during analysis.
As we identified above, cancer type is a likely confounder in our understanding of TP53 mutations. TP53 is the most commonly mutated gene in cancer generally, but do you think it's mutated in all cancer types equally?
Click on the Cancer Types Summary tab. As you can see the proportion of tumours with TP53 mutations does vary a lot. In the plot, green is any kind of single nucleotide mutation, and the other colours represent copy number changes changes such as deletions.
Have a play with the y-axis value (does Counts change your interpretation? Is frequency or count more informative?), and changing from Cancer Study to Cancer Type to Cancer Type Detailed. What patterns can you see?
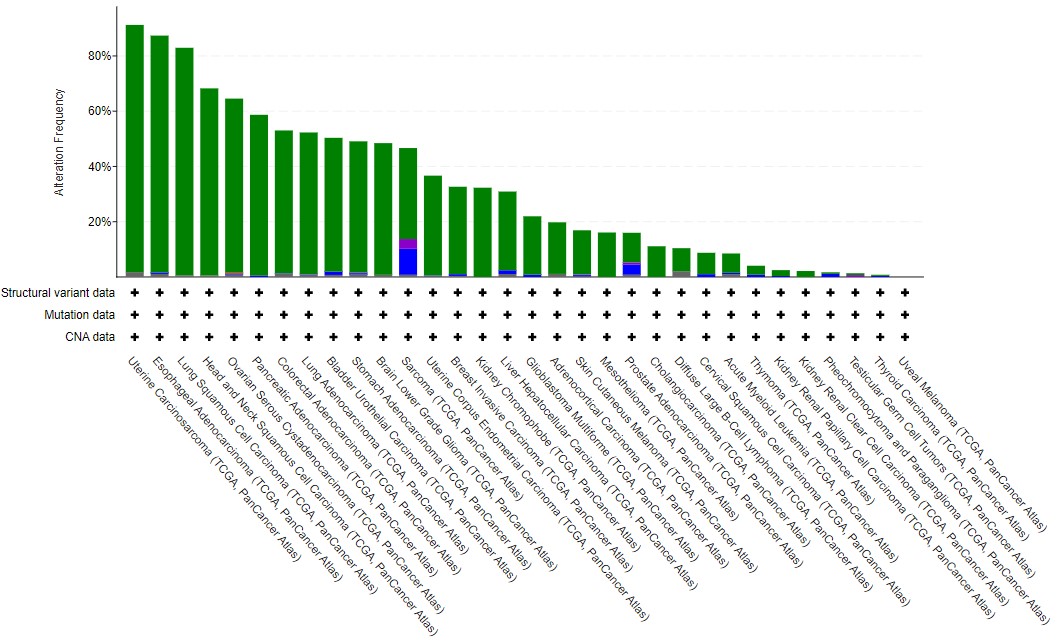
In general terms, solid cancers (rather than blood cancers) with a high mutational burden tend to have TP53 mutations - see the lung, esophageal, colorectal and bladder datasets, compared to Acute Myeloid Leukaemia or B cell lymphoma. As this is biology, there are some that bend this observation - particularly the two types of kidney cancer found in TCGA. Often, general observations hide features which are cancer-specific (and even specific to subtypes within those cancers).
This tutorial has given you an introduction to some of the power cBioPortal has for cancer research. It makes large data (usually the sole focus of bioinformaticians) accessible to laboratory scientists, students, clinicians and the general public. But, there is so much more you can find out.
Try hovering your mouse over one of the cancer type bars in the Cancer Types Summary plot and then select the study name from the box which appears. This takes you to the cBioPortal dashboard for this study - there is so much data here! Take a look about (using this link to return to the Cancer Study summary graph if needed) and see how much information there is!
Task 1A - the pan-cancer importance of TP53 mutations
We are now going to explore mutations in TP53 and other genes in a sarcoma case study. By looking in multiple cancers we can see whether or not TP53 mutations are common in all cancers, or whether there is variability. As we're working with biological data, there is a lot of variability!
Start to think about why that might be. P53 (the protein name for the product from the TP53 gene) regulates cell proliferation and cell death. Tumours need to escape P53 activity. But is mutating P53 the only way for a tumour to do this? And is regulating proliferation and cell death the only way for a tumour to form? Clearly not, because not every tumour has a TP53 mutation, and tumours have a large number of ways to evade detection and eradication in the body.
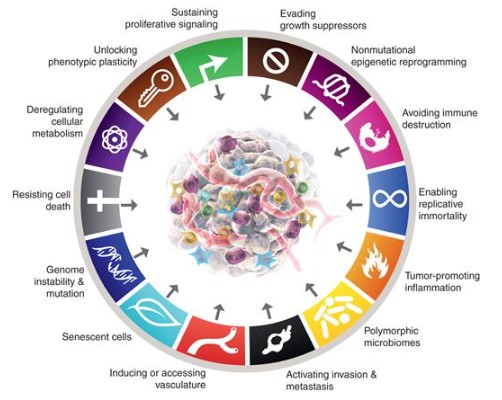
In his epic (third) review of the Hallmarks of Cancer published in 2022 (download the PDF here), Professor Douglas Hanahan outlines the different physiological features a cancer must overcome (image below). These are all areas where cancers can effect change on the body in order to survive. Remember, a cancer is under the pressures of evolution in just the same way as an infectious virus, a herd of giraffes, or us - just on a different scale.
Return to the Cancer Study summary graph.
On the Cancer Types Summary graph, hover over the Sarcoma bar on the chart and click on Query this study for TP53. Now focused on this one study, look at the OncoPrint, Mutations and Comparison/Survival tabs.
What do you observe in Sarcoma compared to all cancers from TCGA?
Interestingly, eventhough TP53 mutations are very common in Sarcoma, and the mutations are spread across the protein as before, there is no significant difference in survival.
In biology, proteins rarely act on their own, instead forming pathways with other proteins and molecules to complete functions. Select the Pathways tab.
The top pathway is the eponymous P53 pathway, with TP53 at the centre promoting (arrow) senescence (ageing) and apoptosis (cell death), and inhibiting (flat arrowhead) growth and proliferation.
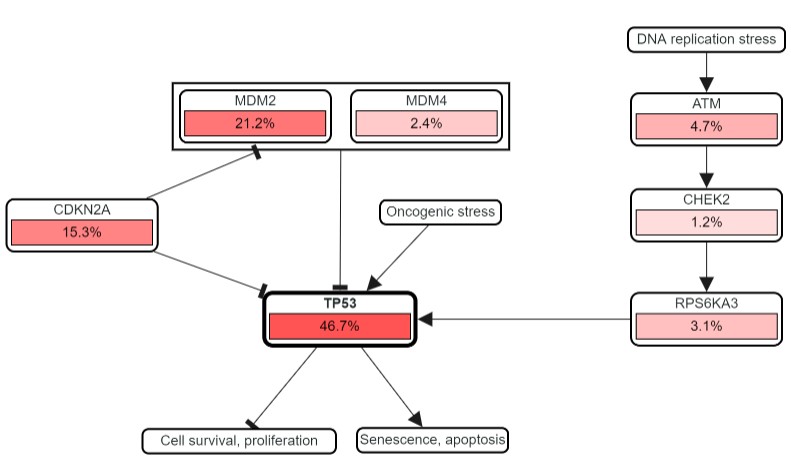
The percentages show how frequently each gene in the pathway is mutated in Sarcoma. TP53 mutations are common, but so are those in CDKN2A and MDM2 - both of which negatively regulate P53. The question is, why mutate other genes in this pathway, particularly if they help to limit the regulatory role of P53? Is this what is actually happening? Let's find out.
At the top of the page, under Sarcoma (TCGA, PanCancer Atlas), click on the pencil symbol next to TP53. Add MDM2 and CDKN2A to the list and Submit Query.
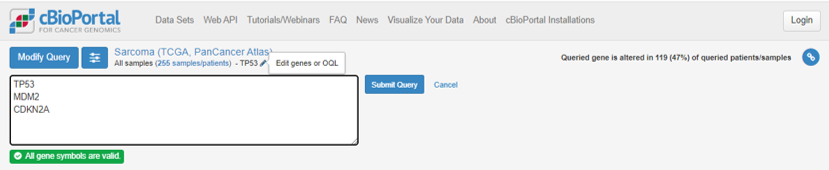
Remember that TP53 was mutated in 47% of Sarcoma cases, but the percentage of tumours with a mutation in at least 1 of TP53, CDKN2A and MDM2 is now 74%.
What does this suggest?
The increased percentage of affected cases suggests people are not commonly mutated in all three genes at the same time.
Head to the OncoPrint tab again - what does this show?
As we thought - cases with a mutation in TP53 very rarely have mutations in the other two genes.

MDM2 is almost never mutated in tumours where TP53 is mutated. This is called mutual exclusivity - simply put, if you have a mutation in one, you don't in the other. Remember in the pathway that MDM2 was seen to inhibit TP53, and the mutations we get in MDM2 are all amplifications - generating more MDM2 protein, and having a bigger inhibtory effect on P53 activity.
The picture is more complicated with CDKN2A but there is little overlap with MDM2 mutations, and most of the TP53 overlap is when there is a missense, change/gain of function in P53 (dark green), rather than a truncating mutation (black).
The importance in tumour biology here is that in 74% of Sarcoma samples, the P53 pathway is being broken. This is happening in multiple ways with the cancer using different mutations. This means that in Sarcoma, we can't just use TP53 mutations as a marker of altered P53 biology - we should use all three genes in tandem.
Now, go back to the Comparison/Survival tab, then the Survival tab. The altered group (a mutation in any one of the three genes) now has much worse survival than the unaltered group, reflecting the negative impact of breaking the P53 pathway, not just breaking P53 itself.
The video below is a walkthrough and explainer for this case study.
Task 2 - exploration of the METABRIC breast cancer dataset
You've now been shown the major plots and ways you can explore the data. You will now use that knowledge to explore the METABRIC study, one of the largest cancer cohorts in cBioPortal.
Breast cancer is one of the best served cancers in terms of genomic resources. Explore METABRIC and consider the following questions, but also take the time to look at other sets including TCGA, a cohort built on large, aggressive tumours (across all tumour types).
Return to the cBioPortal homepage, find and select the METABRIC invasive breast carcinoma cohort, and start to explore by selecting Explore Selected Studies.
Work through the questions below and check your understanding with the brief results given.
1)Are there differences in survival or other clinical data between the 3-gene classifier subtypes?
Hint
Select the 3-gene classifier subtypes from the pie chart, ignoring the NAs, then Compare Groups.Interpretation
Survival curves are very different for the 3 groups (plus the high/low proilferative group).Many clinical values are significantly different (including some obvious ones about mutation status), but look at the plots - do you think these are biologically significant as well?
Look at those clinical values which are not significantly different - are these important?
2)How does ER status survival change over time (5-year vs 10-year vs 20-year)?
Interpretation
ER+ groups do better at first, with the low proliferative group tending to be worse than the high.By 20 years, triple negative BRCA is actually doing better.
Why this might be is still an open topic of research. It's also hard to control for differences in diagnosis, treatment efficacy and lifestyle in such a long analysis.
3)What gene expression or mutation differences can you see between ER+ and ER- BRCA?
Hint
You can do this by choosing the high or low proliferative group, but easier to return to the METABRIC main page and use the ER status pie chart.Interpretation
We see TP53 again!There are lots all in the same cytoband with the same occurence rates - why is this?
In the mRNA there are some nice positive controls, such as high ESR1 expression in the ER+ group. Google some of the top genes (gene + breast cancer as search terms) - do these make sense?
4)Which are the most commonly mutated, likely cancer-related genes? Of the top 10, which are consistent with being tumour supressor genes (TSGs), and which as oncogenes? (Think about the mutation types). Are there hotspots in these with clinical relevance?
Hint
Return to the METABRIC project page.Look at the Mutated Genes table and use Ctrl/Cmd and your mouse to select the top 10. You will see them add to the query box at the top right. Hit query and explore.
Interpretation
Loads of data to enjoy here!Likely TSGs: TP53, KMT2C, GATA3, CDH1, MAP3K1
Likely oncogenes: PIK3CA, TP53
Likely passengers(?): MUC16, AHNAK2, SYNE1, DNAH11
TP53 occupies both TSG and oncogenic roles, depending on the mutation (break vs modify).
Passengers have very few/no mutations consistent with being drivers. Consider applying the OncoKB filter for known "cancer genes" on the METABRIC project page - how does this change your data?
Take time to explore mutual exclusivity, and all the other plots you know about.
5)Consider MUC16. It is not included in the ‘likely cancerous’ list, but is heavily mutated. What data from the lollipop mutation plots make it unlikely related to oncogenesis?
Interpretation
As above, MUC16 mutations are likely passengers - lots of missense changes not in functional domains.MUC16 is massive. Many large genes pick up mutations by chance - they are not necessarily important for cancer progression/biology.
In plots, for mRNA vs mut type, you can see that expression is high and that mutations do not seem to impact expression.
6)Looking across BRCA studies, are there any male samples? If so, how do they compare? Can you compare them confidently?
Hint
Return to the home page.Select all breast cancer studies. You get some warnings for including multiple identical samples from TCGA.
Deselect TCGA studies and only include the TCGA Firehose. Explore Selected Studies.
Go to the Charts tab at the top right and add the pie chart for Sex.
Interpretation
7924 female samples and 36 male samples. You can do a comparison, but the groups are very imbalanced.Plots like the survival plot are hard to interpret confidently - how would you design a study to study the differences between breast cancer in biological males vs females?
Developing your understanding further
This web page will remain accessible for you to refer back, check your understanding and go through the tasks again at your leisure. The best way to develop your learning further is to explore a dataset that you care about - whether that's a specific cancer or a particular sequencing data type.
If you have finished the set tasks quickly, you could take your own deep dive until the next part of the session starts. cBioPortal updates all the time - so if you find something really cool, tell us!
Alternatively, if you want some more (lightly guided, and no provided answers) practice, there are a couple of additional tasks you can reveal below.
AML: blood cancer with low mutational burden
Despite being a rare cancer, Acute Myeloid Leukemia is widely studied, due to its broad age range and very poor survival. Choose the TCGA (NEJM 2013) and OHSU datasets, and select the samples with mutation information.
Kidney cancers: diverse diseases from the same organ
Often the public (and us researchers) conflate multiple cancers together from the same organ. cBioPortal includes TCGA data from both kidney renal papillary cell carcinoma, and clear cell carcinoma. In this task we will explore both, and use some of the limited group functionality comparisons - this can be a bit clunky.
Task sum up
These two tasks should have given you a large exposure to what cBioPortal can show you. Think about how you can use this in your own research. Perhaps you have done an experiment in the lab and you want to know whether a particularly gene is important in the relevant cancer - cBioPortal can help you do this. You can also start with the cBioPortal data for a cancer (or cancers) of interest and approach it as a data question.
Recap and Further Resources, Accessing and using underlying cBioPortal data
Accessing cBioPortal data programmatically using R
I have just talked to you about how you can download the data from cBioPortal yourself, but I've also mentioned that the data formats aren't the nicest. The best way to work with them is in a programming language such as R or Python. Both have supported ways to access cBioPortal (called APIs), but I will give you a demo now on how to do this in R.
If you want to code along rather than just watch, the files you need are below. I'm running it in RStudio. These materials will remain available, so please do work through this at your own speed after the session. I will upload a recorded demo shortly after the session.
The script file to run the demo yourself can be downloaded here - 2024-03-21_cBioPortal_TCGA-BLCA_API_MAF_demo.R
The oncoKB gene list can be downloaded here - 2024-02-08_oncoKB_list.tsv
A jupyter notebook of the code (stored on Gist) can be viewed and downloaded here - Introduction_to_cBioPortal_cbioportalR_and_MAFtools_demo.ipynb
The video below is an indicative recording of the RStudio demo.
Delivery information and support
This tutorial was adapted from an initial in-person training event delivered by Dr Andrew Mason at The University of York on the 11th January 2023. Delivery and development of this material was supported by Elixir-UK and York Against Cancer.
Problem-solving tasks were further refined through a tutorial delivered to MSc students in February 2024. For the delivery of this session on zoom in March 2024, the RStudio section was added to demonstrate the ability to access the data programmatically.